|
|
 |
|
This page was automatically generated by Europe_map-0.5/make_webpage.py on 2007 Jan 23 at 14:55
Europe_map
I am working on software to automatically draw maps of regions of Europe.
The aim is to be able to quickly create maps, mainly intended for illustrating articles about place-names.
These are my working principles:
- all-python code for ease of use and portability
- only public-domain sources of data to be used:
- altitude data at half-minute latitude-longitude resolution from National Geophysical Data Centre. I have packed each datum into one byte to speed up drawing. This gives a 20 metre altitude resolution.
- town and city locations from geonames. I have converted these to python dictionaries.
- high quality pdf (vector graphics) generation for publications; lower quality png (bitmap graphics) generation for webpages and casual viewing
- automatic altitude shading
- automatic labelled mercator grid lines
- names automatically moved to avoid collisions
- names in italics (with '/name') or (to do) bold ('*name')
- aspect ratio automatically adjusted to minimize map distortion
- several levels of usage:
- at the highest level, some utility programs are provided e.g. to search for names in a text file, look up their locations in a database (UK only at present) and plot them; or to search a text file for names closely followed by latitude, longitude pairs and plot them. A suitable bounding region will be worked out.
- at the middle level, the user just provides a list of names and locations in latitude, longitude format.
- at the lowest level, the user opens a map (specifying the region of interest), draws points and text on it, adds altitude coloring, etc.
Altitude coloring is tricky - a good trade-off between visual
attractiveness and clarity is hard to achieve. Also, we want to keep colors
light to save toner when printing maps. I am still working on this.
Apart from this, the software is ready to be released soon.
example 00
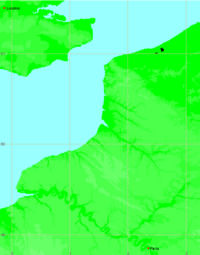
The simplest possible map - just create a python dictionary with names and latitude,longitude pairs, and call Europe_map_from_dict. Map limits will be automatically adjusted. png and pdf output files are made, their names being formed by adding .png and .pdf to the given filename stem.
from europe_map import Europe_map_from_dict
Europe_map_from_dict({
'London': (51.5086,-0.1264),
'Paris' : (48.8529,2.3491)
},fn='example_00',fontsize=18)
|
 |
| png pdf |
If your names and latitude,longitude pairs are in a tab-separated text file, you can create the dictionary something like this:
d=dict([tuple(i.split('')) for i in file('file.txt','r').read().split('\n')])
example 01
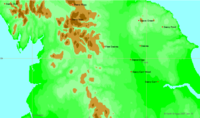
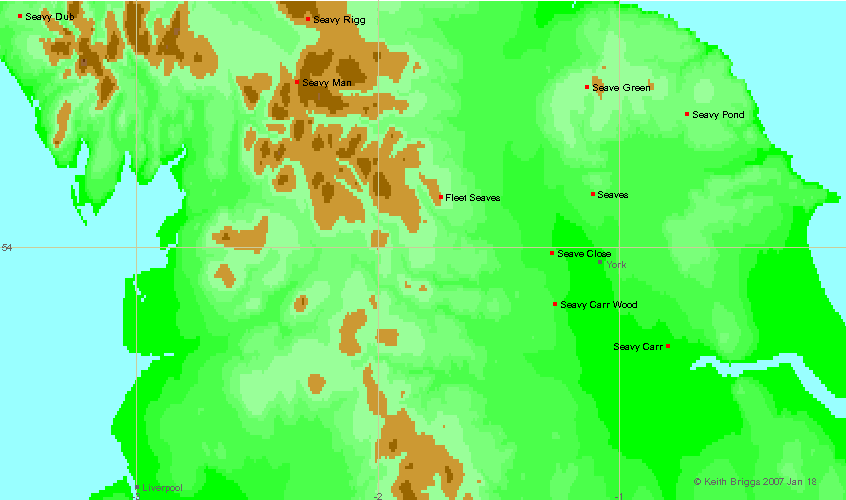
A bit more complex - more places. Note that starting a name with '-' causes it to be placed on the left of its dot, and starting with '|' puts the name in gray. A list of obscure places is given by a dictionary of grid references. Two big places are looked up from the database in the package.
from europe_map import Europe_map_from_dict, uk_place_dict
sef_ngs={
'Seave Close':'SE 474 556',
'Seave Green':'NZ 563 001',
'Seaves':'SE 585 715',
'Fleet Seaves':'SE 175 705',
'Seavy Dub':'NY 049 203',
'Seavy Man':'NY 786 014',
'Seavy Pond':'SE 832 935',
'Seavy Carr Wood':'SE 481 412',
'-Seavy Carr':'SE 796 300',
'Seavy Rigg':'NY 814 181',
}
sef_ngs['|Liverpool']=uk_place_dict['Liverpool'][0]
sef_ngs['|York']=uk_place_dict['York'][0]
Europe_map_from_dict(sef_ngs,mxht=2000.0,fn='example_01',copyright='Keith Briggs')
|
 |
| png pdf |
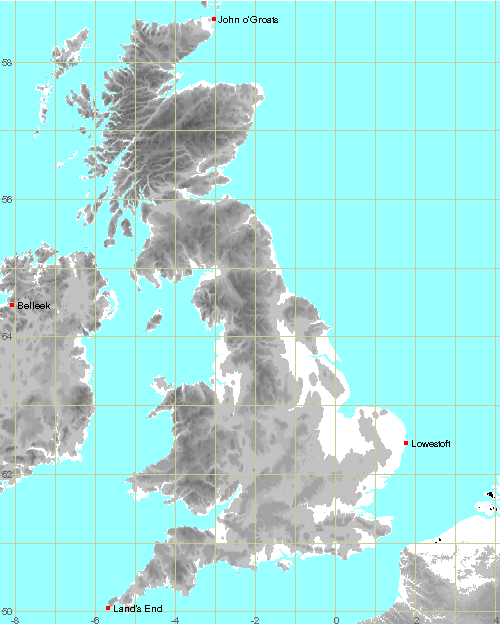
example 02
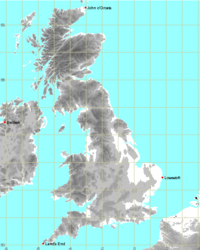
A grayscale relief shading, better if you are not publishing in colour.
Notice the the software automatically detects whether you have given a grid reference or a latitude,longitude pair, and does the right thing.
from europe_map import Europe_map_from_dict
Europe_map_from_dict({
"Land's End": 'SW 342 252',
"John o'Groats": 'ND 381 726',
"Lowestoft": 'TM 545 9256',
"Belleek": (54.473,-8.101),
},
fn='example_02',grayscale=True)
|
 |
| png pdf |
example 10
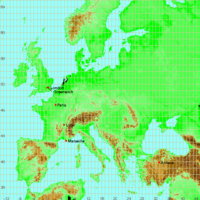
Low level usage - all information entered by hand. Notice that the name "Greenwich" is moved to avoid a collision with "London". This is done by default to all names.
from europe_map import Europe_map
map=Europe_map(pdf='example_10.pdf',copyright='Keith Briggs')
map.add_heights()
map.add_grid()
map.add_point(51.5,0.2,'London')
map.add_point(51.5,0.0,'Greenwich')
map.add_point(48.8594,2.3453,'Paris')
map.add_point(45.7483,4.8213,'Lyon')
map.add_point(43.2956,5.3742,'Marseille')
map.add_point(39.9293,32.8533,'Ankara')
map.add_labels()
map.save('example_10.png')
|
 |
| png pdf |
This website uses no cookies. This page was last modified 2024-01-21 10:57
by  . .
|
|